CHATSKU · B2B CHATCOMMERCE
The March of Commerce · Revenue Model
Revenue Left on the Table
Pick where the catalog sits on the maturity curve, set the assumptions, and see the revenue at risk, the cost to fix it, and the net gain.
$
Total annual sales for the business you are modeling.
Where the prospect's buying experience sits today.
15%70%
New acquisition plus competitively shoppable orders. Not locked contracts or habitual reorders.
Range 15% to 70%How much of your revenue is genuinely in play. The low end is a business that is mostly locked contracts and habitual reorders. The high end is heavy on new accounts and orders a competitor could win. Set it to your share of contestable business.
40%90%
Share who prefer a rep-free path. Gartner 67 to 70%, LinkedIn 75%.
Range 40% to 90%Buyers who prefer to research and buy without a rep. Gartner puts this at 67 to 70%, LinkedIn at 75%. Lower it for relationship-heavy categories, raise it for digitally mature buyers. Above 75% goes past the published figures.
2%35%
Share of self-serve demand lost at this stage. Each stage carries its own default.
Range 2% to 35%The share of self-serve demand a stage loses to dead ends, abandonment, and no answers. It is set per stage and rises the further the experience falls behind the buyer: a PDF sits near the top, a working platform near the bottom. Anchored by 75% who switch for a better experience and 41% who cannot locate products.
10%60%
Share of the leak ChatSKU closes.
Range 10% to 60%The share of the leak ChatSKU recovers by answering buyers from your existing catalog. Higher for stages starting from zero self-serve, like a PDF, where the jump is largest. A directional estimate, tune it to real results.
A recovered buyer reorders for years. B2B accounts run 3 to 7.
$
One-time onboarding fee.
$/mo
Recurring subscription.
Lifetime Value Recovered
$862,400
$215,600 / yr
Lifetime ChatSKU Cost
$38,500
$2,500 setup + $750/mo × 48
Net Lifetime Gain
$823,900
recovered minus cost
Return on Spend
22x
per $1 invested
Stop estimating the leak. Start closing it.
Every month the catalog stays static, that revenue keeps walking.
Method. Annual revenue at risk = Revenue × Contestable share × Self-serve buyers × Stage leakage. That leak recurs yearly and a recovered buyer keeps reordering, so lifetime value recovered = annual recovered × customer lifetime. Lifetime cost = setup + monthly × 12 × lifetime. Net gain = recovered minus cost, over the same horizon.
Sources. LinkedIn, The Trust Advantage (2026) · Gartner B2B buyer surveys (2026): 67% rep-free, 70% fully self-service · Sana Commerce B2B Buyer Report (2025): 75% would switch for a better experience, 91% among US buyers, 41% of manufacturing buyers cannot locate products · Atwix B2B conversion benchmarks (2026).
Note. A modeled, directional estimate for illustration, not a guarantee. Replace the cost fields with real ChatSKU pricing and adjust the assumptions to fit the business.
ChatSKU Pricing Estimator
Estimated ChatSKU price
adjust your usage in the calculator
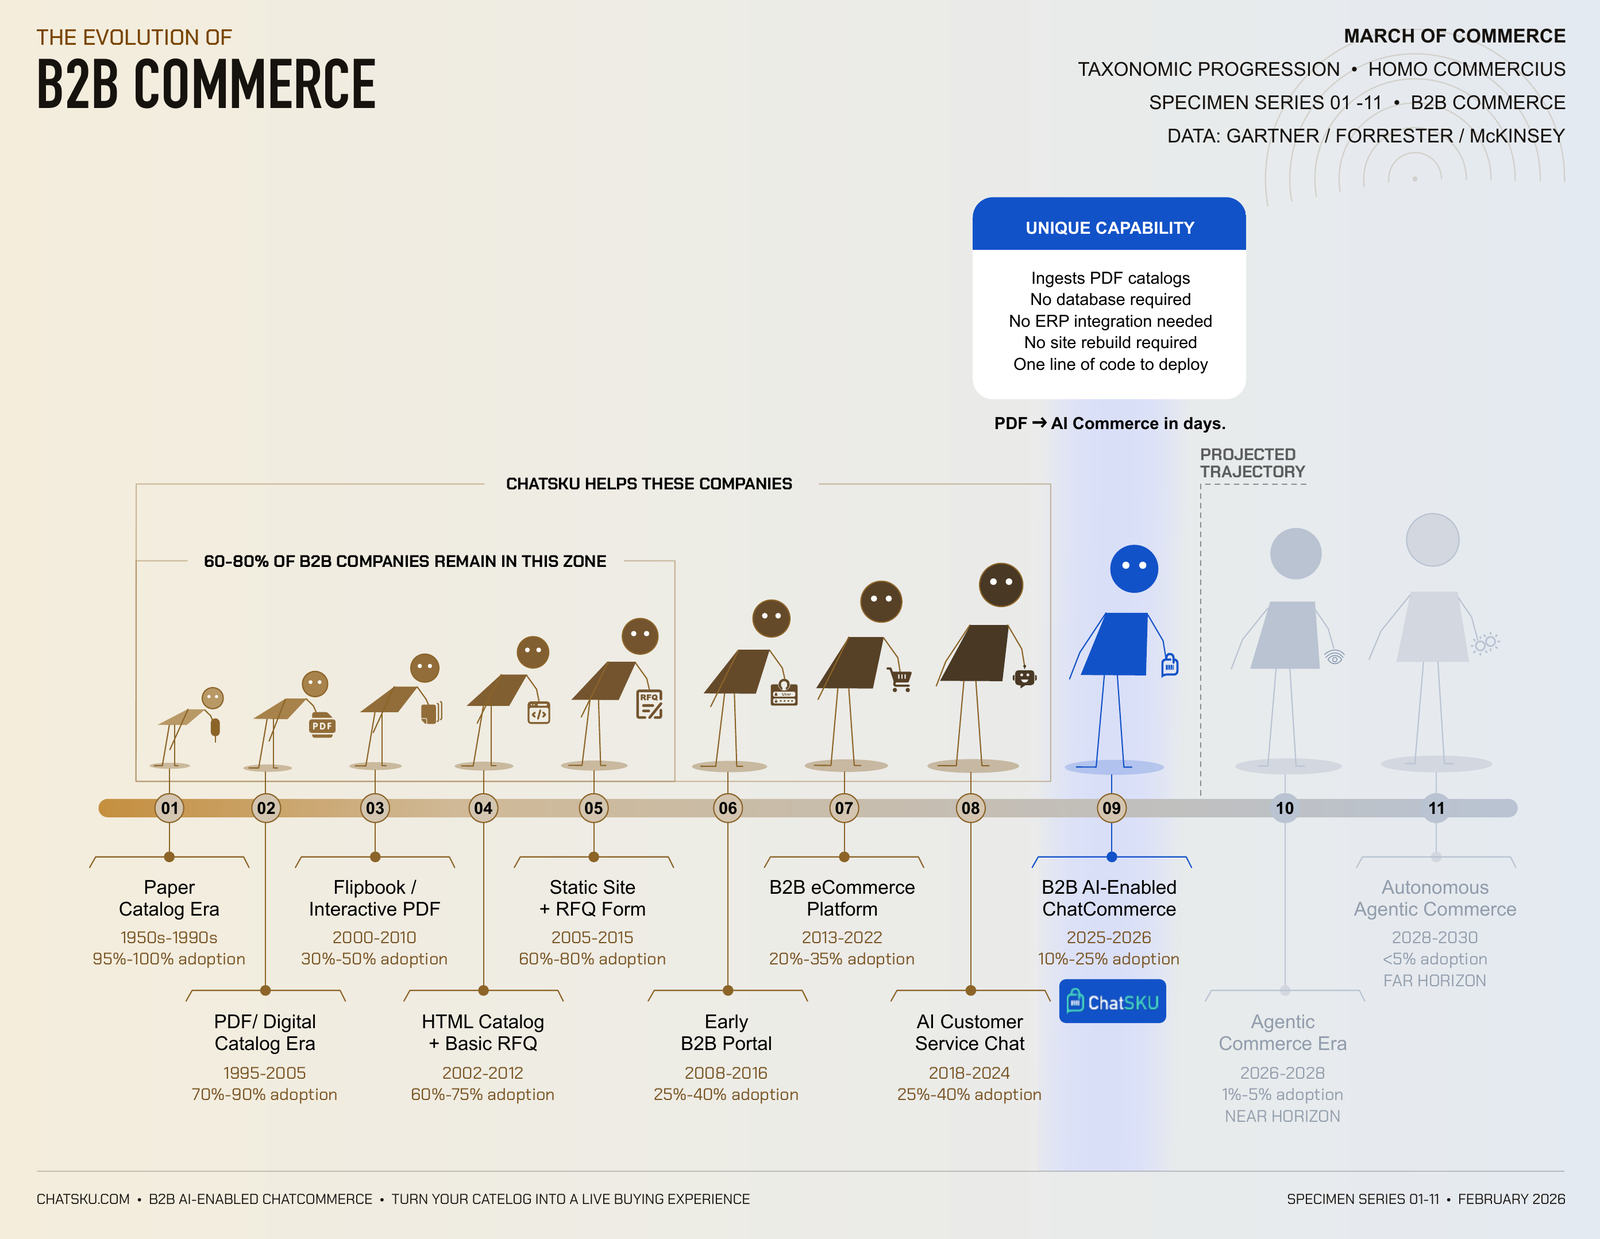
The March of Commerce · B2B Commerce Evolution